
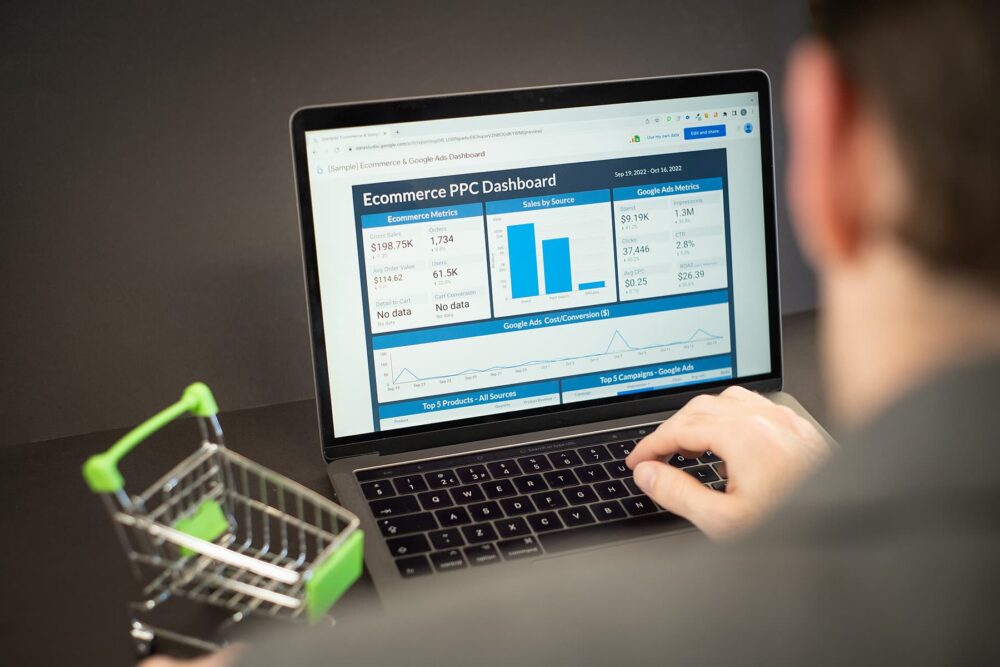
Ecommerce seller analytics platforms pull data from your sales channels and convert it into answers to three basic questions: Which products and channels are actually profitable? How fast is inventory moving? What’s driving or killing margin, including ads and fees? For a small Canadian or US seller working across Amazon, Shopify, Walmart or Etsy, the right analytics tool depends heavily on which channels you use and how complex your sourcing and advertising have become. Some platforms are laser‑focused on Amazon only; others track multiple marketplaces and even overall brand health.
If you mostly sell on one marketplace, a single‑channel dashboard can give you very deep profit and PPC visibility there. If you’re juggling several channels and cross‑border stock, you’ll usually be better off with a multichannel tool that shows the whole picture in one place, even if each module is a bit less detailed.
What Ecommerce Seller Analytics Does and How the Market Is Structured
At a high level, ecommerce seller analytics means using software to monitor, interpret, and optimize performance across online marketplaces. Tools like Sellertics describe their job as turning marketplace data on sales, inventory, pricing, and advertising into actionable insights for serious sellers. Editorial explainers such as Ecom10x’s overview make the same point: the platforms centralize marketplace data so you can decide which products to stock, how to price them, and where to invest marketing budget.
For marketplace and small‑brand sellers, the market roughly breaks into three buckets:
- Single‑channel profit tools – deeply analyze one marketplace, typically Amazon, often with embedded PPC and fee tracking.
- Multichannel seller platforms – connect to many marketplaces and shopping carts (Amazon, Walmart, eBay, Etsy, Shopify, etc.) and surface unified sales and inventory analytics.
- Brand‑health and marketplace intelligence tools – focus less on per‑SKU accounting and more on how your brand is performing across marketplaces: share of voice, reviews, pricing consistency, and competitive benchmarking.
Each bucket solves a different pain. A high‑volume FBA seller drowning in fees and PPC needs clarity on Amazon profit. A small brand selling the same products across three or four channels needs one view of stock, margin and ad spend. A manufacturer trying to manage dozens of resellers needs to know where the brand is winning or losing.
Types of Seller Analytics Platforms and How They Work Across Channels
1. Single‑channel profit and PPC tools
Several tools focus primarily on Amazon and treat everything else as secondary. Search results and reviews describe Sellerboard, for example, as profit analytics and PPC management aimed at Amazon sellers, tracking real‑time profits and expenses.
These tools usually connect via the marketplace’s official APIs, then:
- Pull order, fee, refund and advertising data from Amazon.
- Reconcile it into SKU‑level profitability views.
- Surface alerts on low‑margin items, high ad spend or inventory risk.
Some offer light support for other marketplaces, but their workflows, terminology and reports are clearly built around Amazon. If you’re 95% FBA or FBM and only dabble elsewhere, the depth can be worth losing multichannel breadth.
2. True multichannel seller analytics platforms
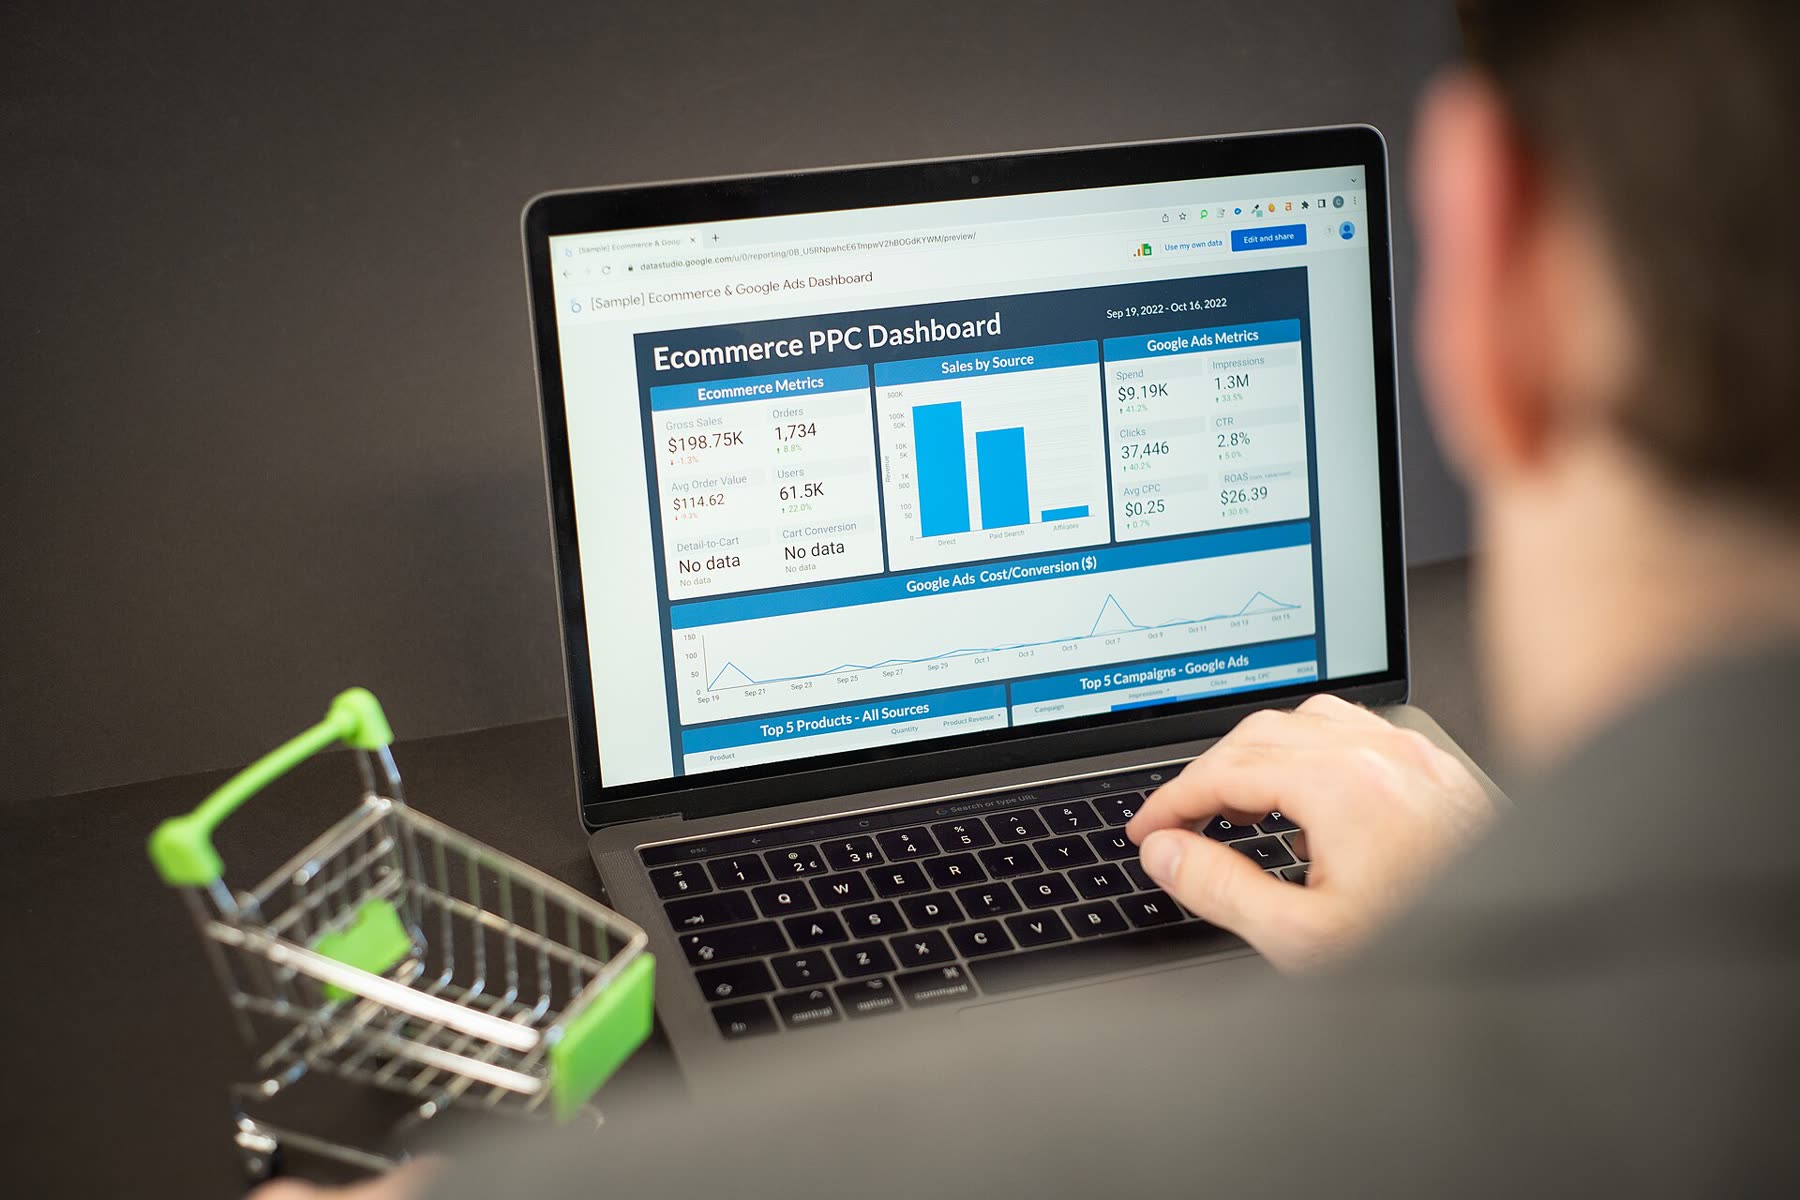
Multichannel platforms start from a different premise: sellers want one view across many channels. SellerActive’s multichannel analytics is a good example. It advertises tracking sales, inventory and channel performance across 20+ sales channels, giving marketplace sellers a real‑time view of where products sell best and how demand patterns differ by channel.
Similarly, PayHelm’s marketplace analytics focuses on Amazon, eBay, Etsy and Walmart sellers, with an emphasis on cross‑channel profitability and performance insights. KwickMetrics positions itself as a platform for Amazon and Walmart, combining analytics for sellers and agencies.
Under the hood, multichannel platforms typically:
- Integrate with each marketplace’s APIs plus carts like Shopify.
- Normalize data so one SKU’s performance can be compared across channels.
- Show consolidated dashboards: total sales by day, margin by channel, inventory aging across all warehouses.
Because they’re doing more integration work, they often go a bit lighter on per‑marketplace quirks than a dedicated Amazon tool, but you gain a coherent cross‑channel picture.
Here’s a compact way to think about the difference:
| Platform focus | Typical channels covered | Strength for sellers |
|---|---|---|
| Amazon‑centric profit tools | Primarily Amazon | Deep fee/PPC profit detail for FBA/FBM sellers |
| Multichannel seller analytics | Amazon, Walmart, eBay, Etsy, Shopify and others | One view of sales, margin and stock across many marketplaces |
| Brand‑health intelligence | Multiple marketplaces, often including retailers | Brand consistency, share of voice, review and pricing health |
3. Brand‑health and marketplace intelligence tools
Brand‑oriented platforms like Lupa Analytics pitch brand health intelligence for online marketplaces. Instead of telling you the profit on each SKU, they track signals such as pricing, reviews and visibility across your resellers and channels.
For a small seller, this type of tool is most useful when you’re evolving from “I sell on Amazon and Shopify” to “lots of other sellers carry my products, and I need to manage the brand.” It won’t replace basic P&L analytics, but it can highlight where your brand is being undercut or poorly represented.
Comparing Platforms and Matching Them to Your Seller Profile
Analytics tools become useful only when they match your actual business. Omnichannel comparison guides, such as Trivas’s evaluation framework, suggest looking first at channel coverage, data latency, and workflow depth. For a small cross‑border seller, you can translate that into a few practical questions.
Scenario 1: FBA‑only or Amazon‑heavy
If 90%+ of your revenue is from Amazon.ca/.com and you’re experimenting with PPC or complex fee structures:
- A profit‑and‑PPC‑oriented tool that’s primarily Amazon‑focused makes sense.
- You’ll get much clearer SKU‑level margin, ad ROAS, and fee visibility than most multichannel dashboards.
- Cross‑border sourcing decisions (MOQ, shipping, currency) still matter, but you’ll be making them around Amazon data.
For buyers testing wholesale marketplaces, you would export your top‑performing Amazon SKUs, estimate landed cost from suppliers, then see how new sourcing options affect profit in the Amazon dashboard.
Scenario 2: Shopify plus 2-3 marketplaces
If you’re a small brand with a Shopify store and listings on Amazon, Walmart and maybe Etsy:
- A multichannel analytics platform like SellerActive, PayHelm or KwickMetrics is usually a better fit.
- You need one view of inventory and margin across all channels, or you’ll over‑buy based on one marketplace’s performance.
- Data latency matters — if a platform only updates daily, same‑day pricing and promo decisions are harder.
For cross‑border sourcing, multichannel analytics helps you see how a bulk purchase plays out across all channels. If a product is profitable on Amazon but dead weight on Walmart, you may negotiate lower MOQ with your supplier instead of committing to a large DHgate or Alibaba order based on one channel’s success.
Scenario 3: Growing brand with many resellers
If others are selling your products on various marketplaces or you’re in talks with distributors:
- Consider adding a brand‑health tool such as Lupa Analytics on top of your basic P&L stack.
- Use it to monitor pricing consistency, review patterns and where your brand is visible or absent.
This matters for cross‑border sourcing because large orders lock you into a product strategy. Brand‑health signals can tell you whether the market is absorbing your products in a way that justifies bigger purchase commitments.
Where wholesale marketplaces like DHgate enter the picture
Wholesale‑focused platforms such as DHgate present themselves, in editorial content, as sourcing marketplaces built around bulk purchasing and seller reliability for entrepreneurs. That positioning can appeal if your analytics show that a product is consistently profitable and you’re ready to move from small test buys to larger, cross‑border orders.
The buyer‑first way to use analytics here is:
- Start with your data: margin by SKU and channel, inventory turns, and ad spend.
- If a product looks like a candidate for bulk sourcing, compare options across wholesale marketplaces (DHgate, Alibaba, others) and retail‑oriented platforms.
Analytics won’t tell you which supplier is trustworthy, but it will tell you which products and volumes justify taking sourcing risk at all. For deeper background on how DHgate itself works as a marketplace, you can read our overview of DHgate alongside broader comparisons of online marketplaces and shopping platforms and DHgate vs AliExpress, Alibaba and Temu.
If you’re still small and testing products, favor tools that clarify per‑SKU profitability quickly over complex brand‑health dashboards. As you grow into multichannel and bulk sourcing, that’s when omnichannel analytics and marketplace intelligence start to earn their keep.